
Discover our latest resources
Filter posts:
-

Canadian Manufacturing Technology Show (CMTS)
Meet us at Booth 1541& 1941 on Sep. 29 - Oct. 2, 2025 in Toronto!
Learn More -
-
Manufacturing World Tokyo
Meet us at Booth 60-42 on Jul. 9th - 11th, 2025 in Tokyo!
Learn More -
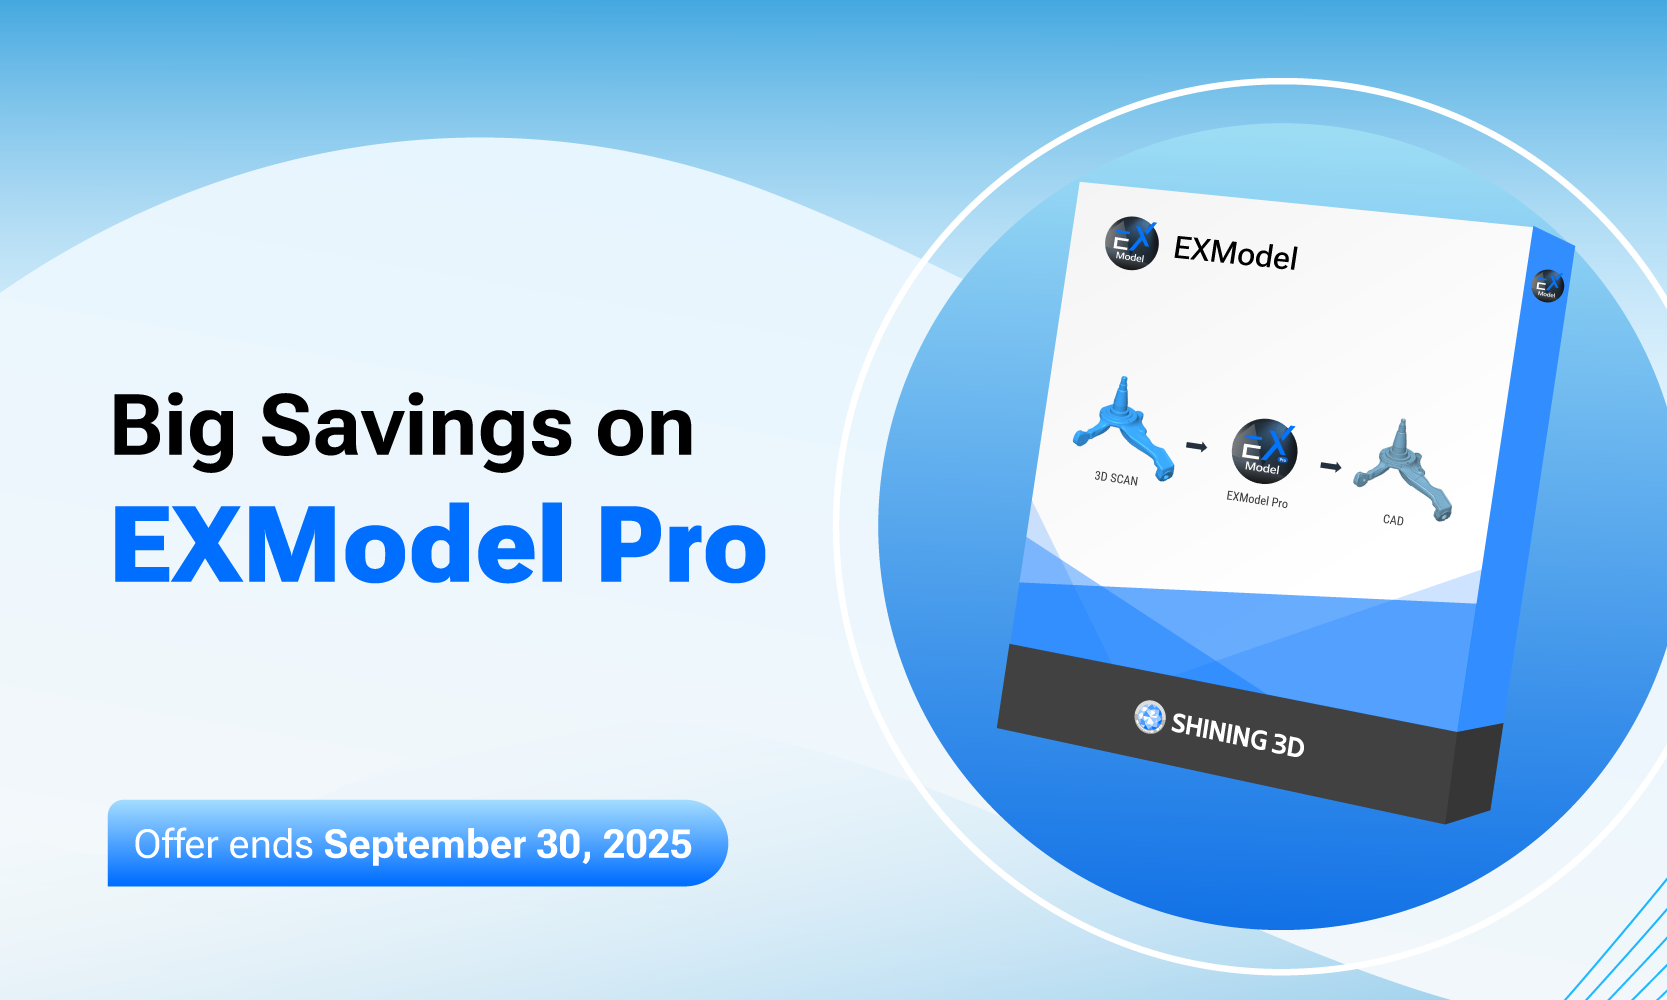
Limited-Time Offer to Help You Unlock the Full Power of EXModel Pro
SHINING 3D launches a series of limited-time offers for EXModel Pro.
Learn More -
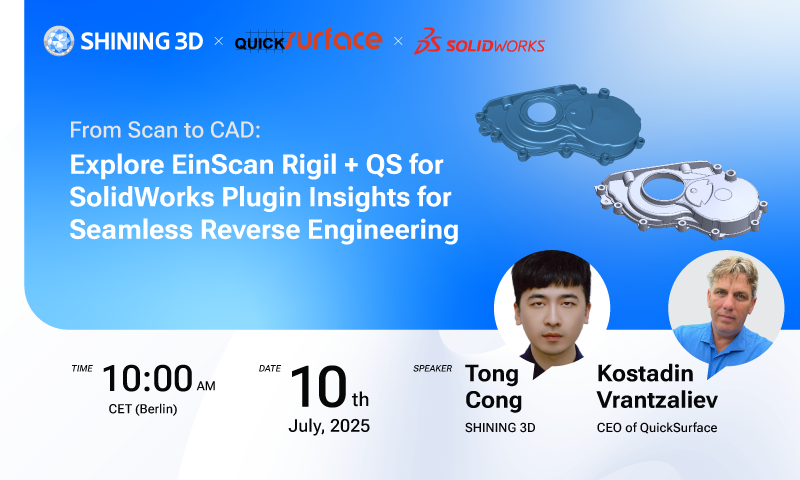
EinScan Rigil + QuickSurface for SolidWorks Plugin Insights for Seamless Reverse Engineering
Language: English
Rewatch -
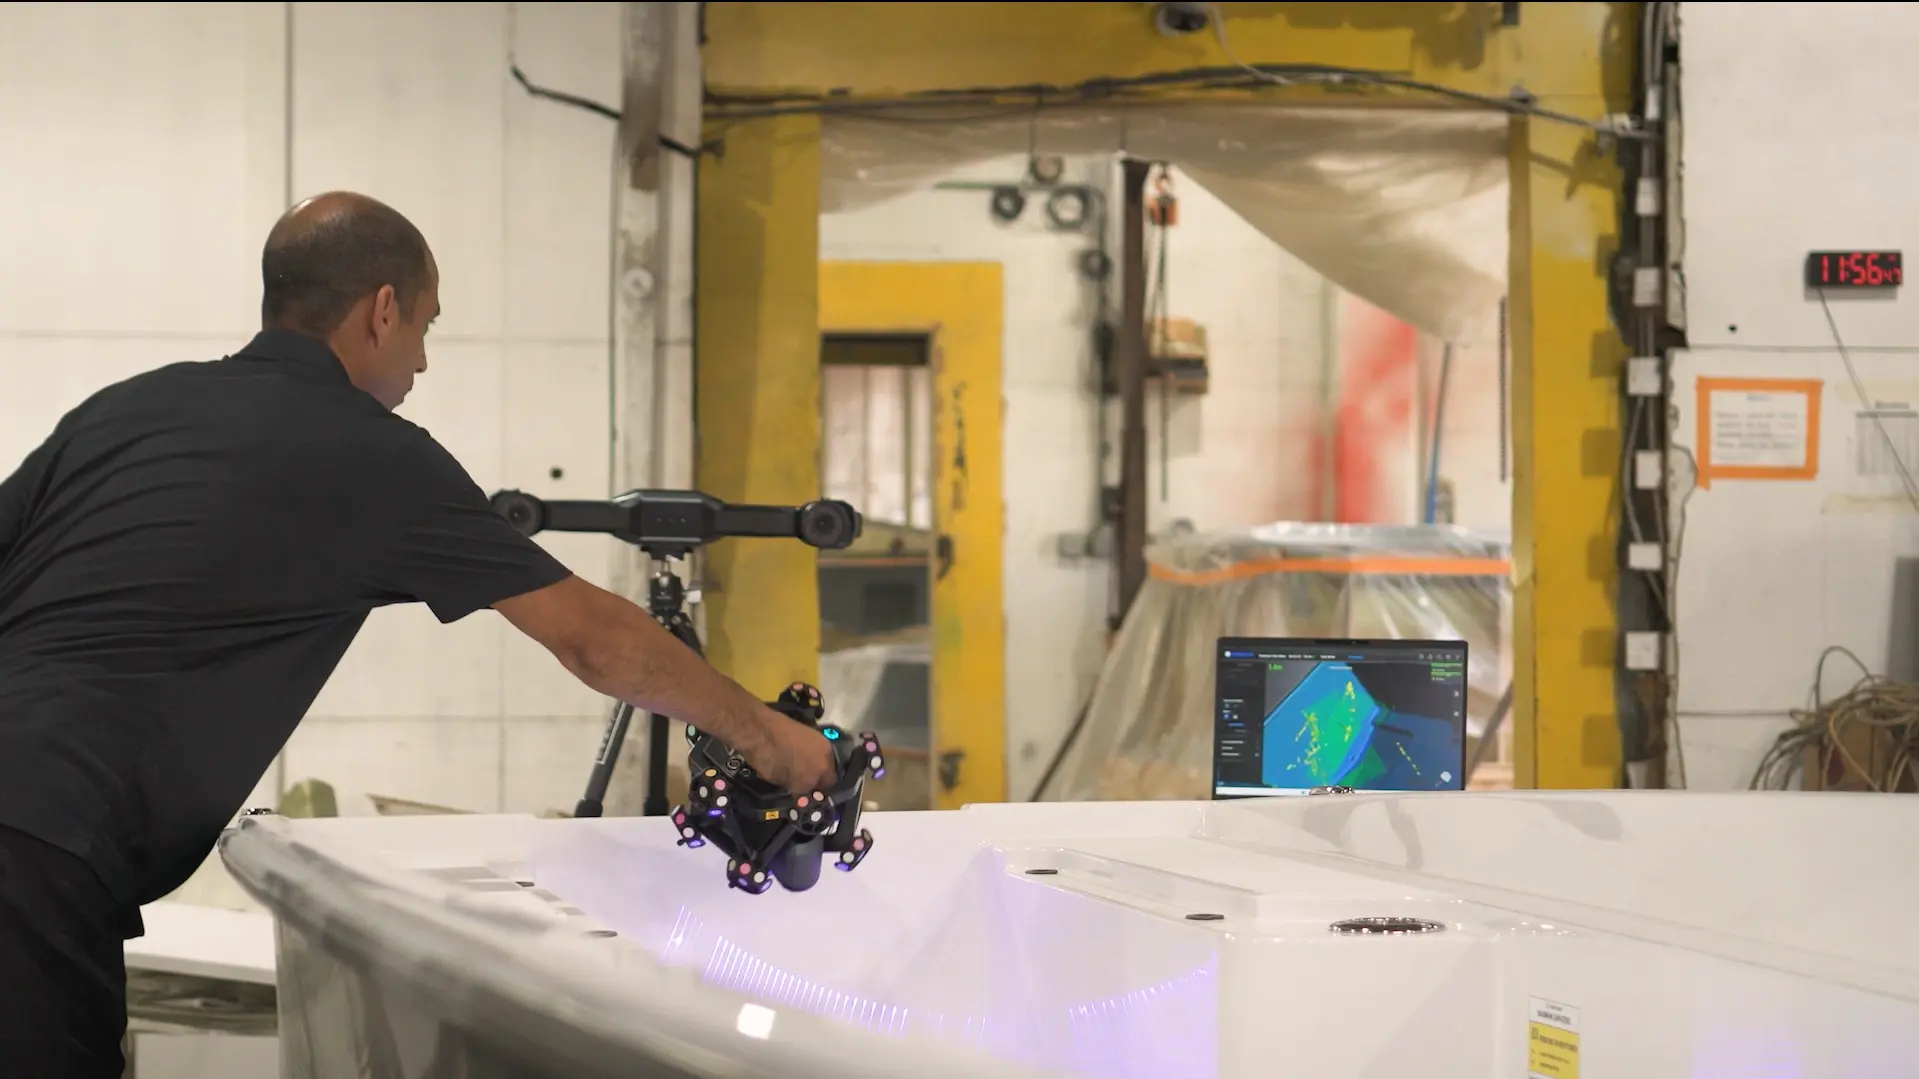
How High-Accuracy 3D Scanning Technology Advances Marine Mold Manufacturing and Inspection
Discover how SHINING 3D’s FreeScan Trak Nova enhances marine mold manufacturing and inspection, enabling accurate 3D scanning, reverse engineering, and CAD-based part validation for the boatbuilding industry.
Learn More -
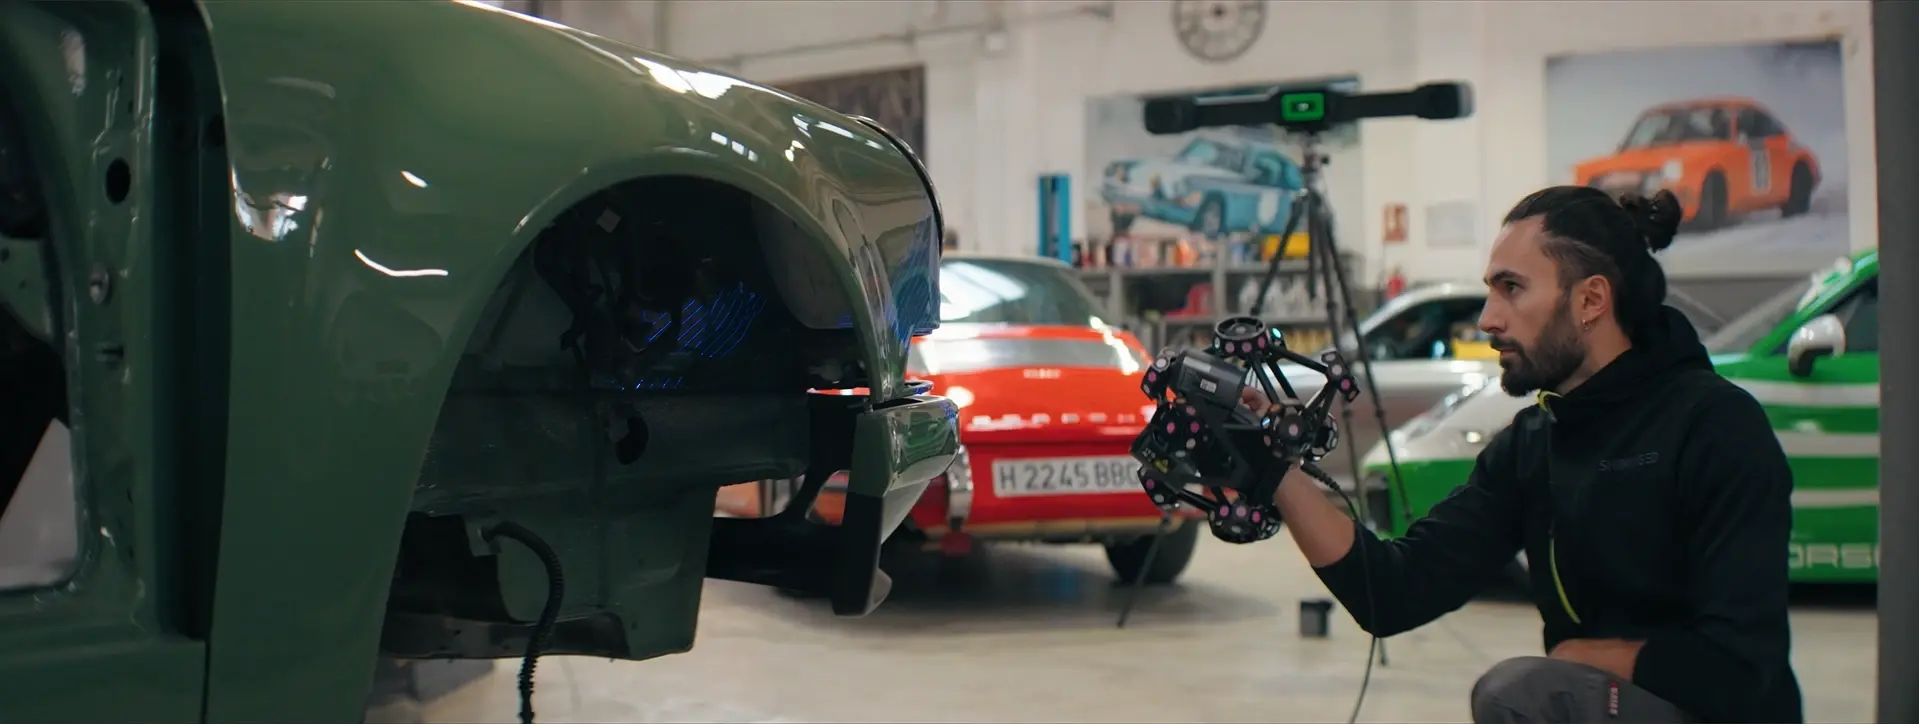
Juliá Automobile x SHINING 3D: When Passion Meets 3D Scanning Technology, Classic Porsche Reborn
This article highlights how Spain Porsche restoration expert Juliá Automobile leveraged SHINING 3D's FreeScan Trak ProW to complete a high-accuracy reverse engineering project for a 1995 Porsche 993.
Learn More -
-
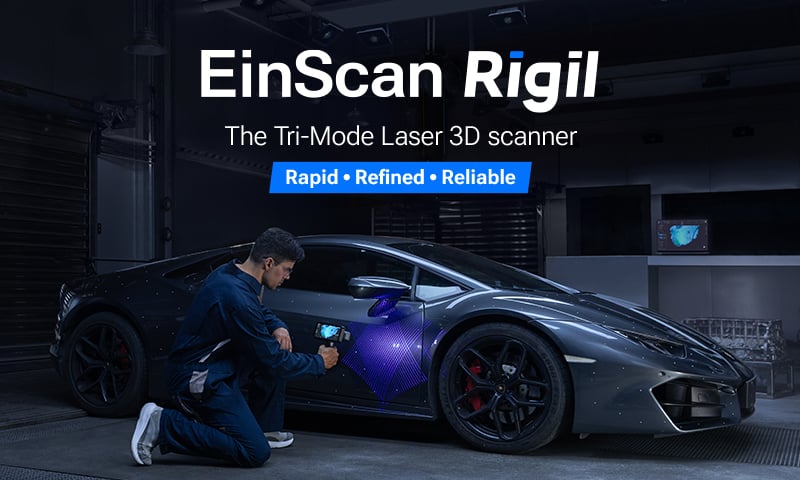
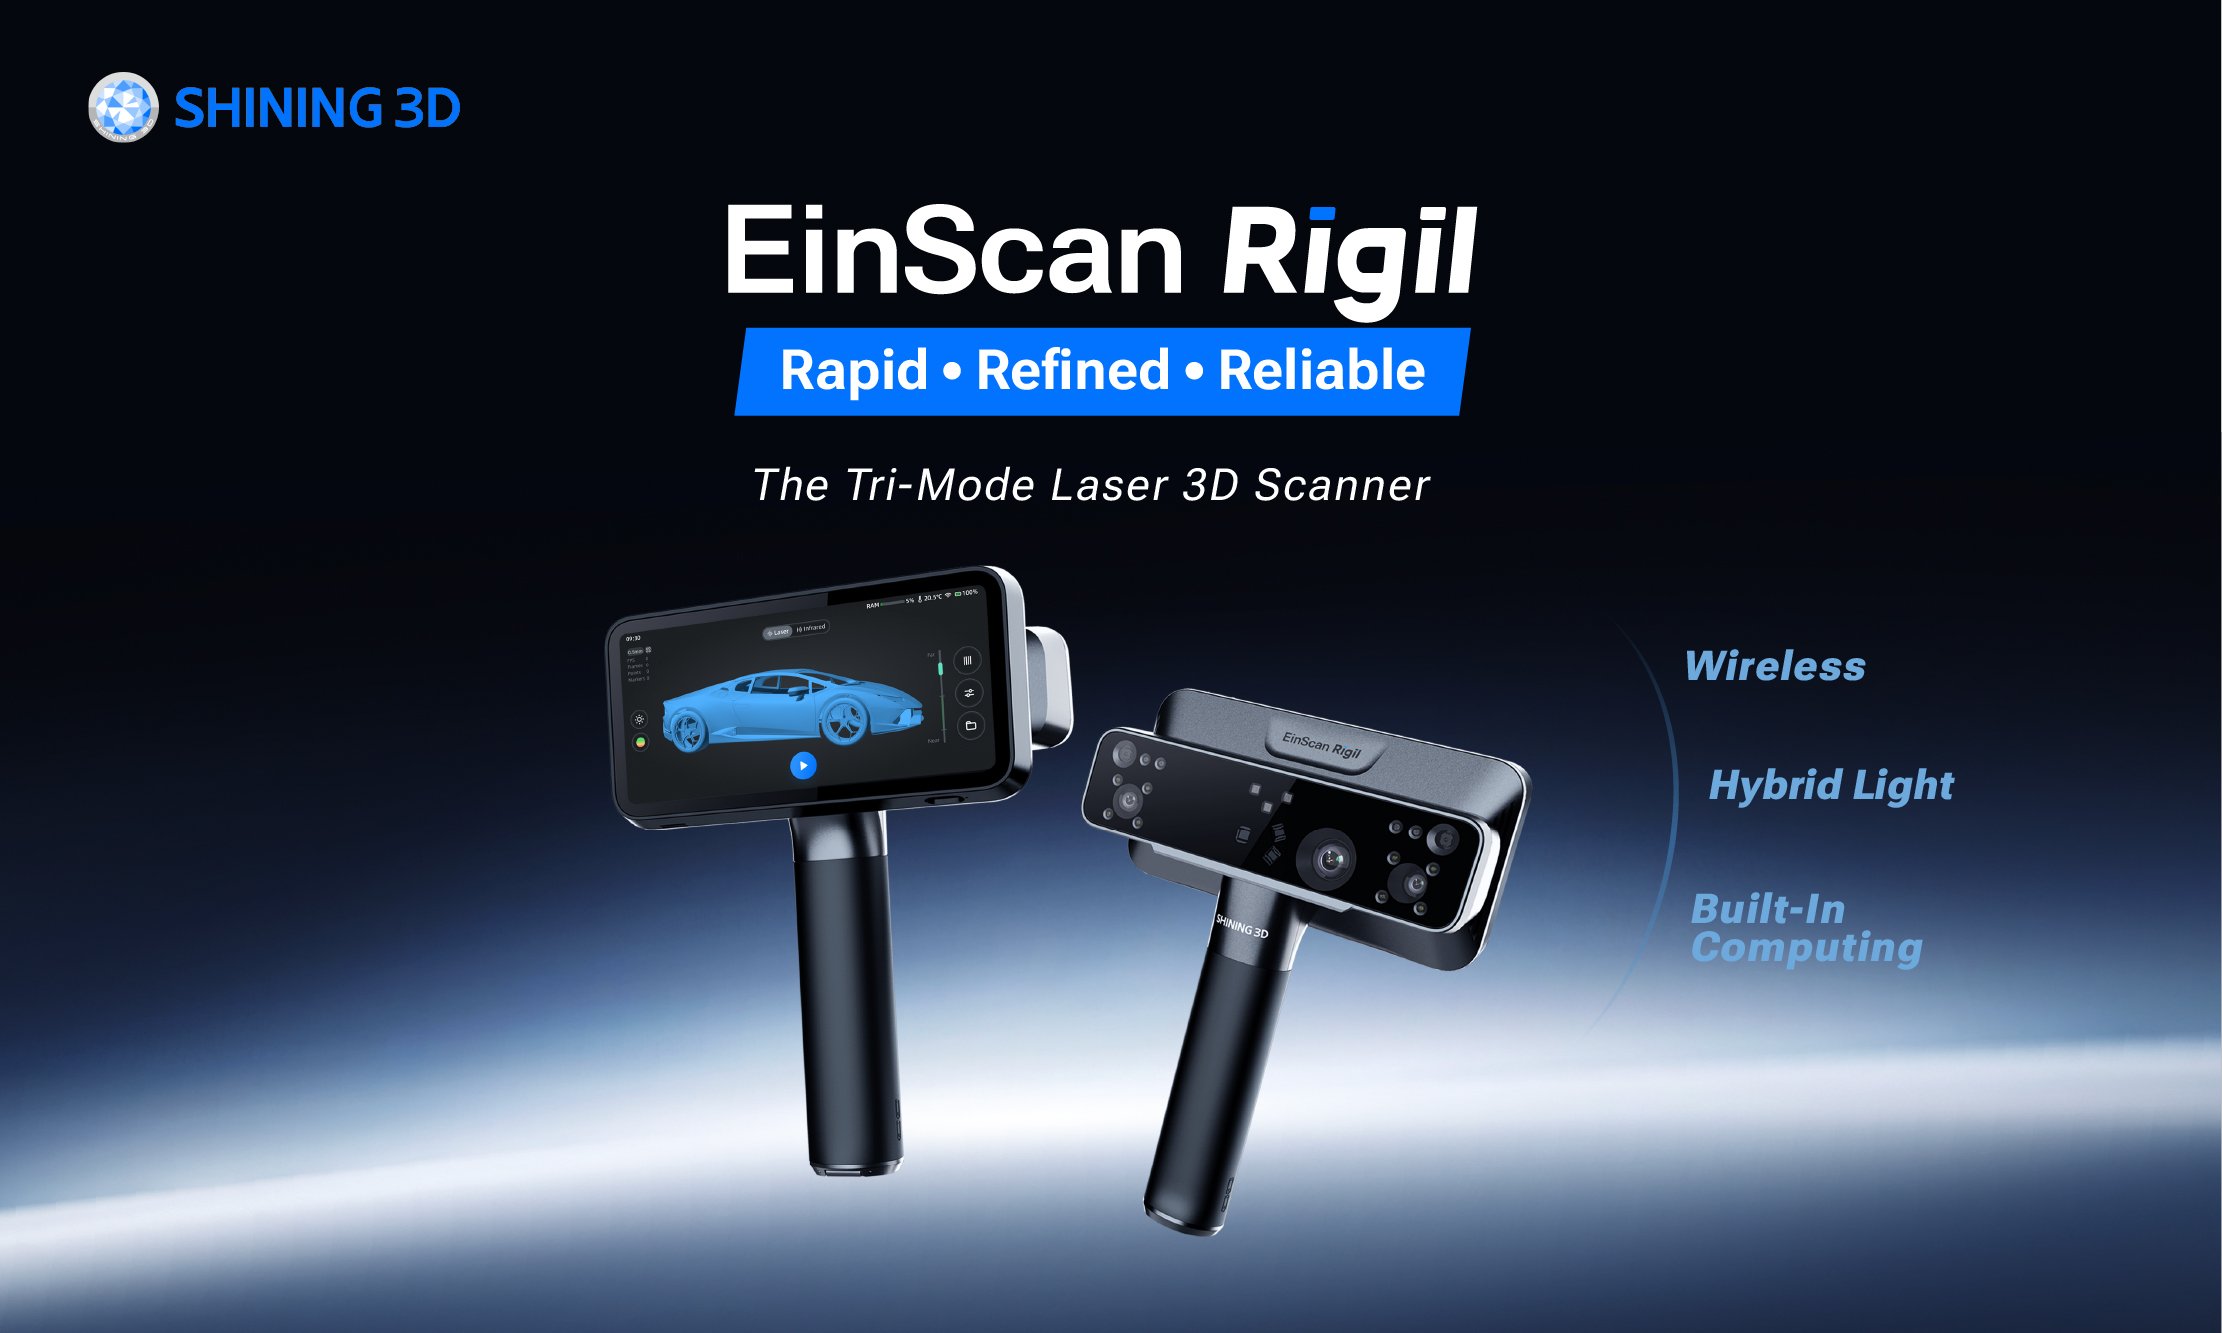
EinScan Rigil Launched: The World’s First Tri-Mode Laser 3D Scanner
SHINING 3D is proud to announce the launch of EinScan Rigil, our latest 3D scanner designed to deliver rapid, refined, and reliable scanning capabilities for a variety of applications.
Learn More